มาทำความรู้จักร Signal Processing Basics กัน
Signal processing คือ การประมวลผลสัญญาณเป็นสาขาที่เกี่ยวข้องกับการวิเคราะห์ ปรับเปลี่ยน และจัดการสัญญาณ สัญญาณอาจเป็นได้หลายอย่าง เช่น คลื่นเสียง ภาพ หรือแม้แต่ข้อมูลทางวิทยาศาสตร์
สัญญาณที่มีอยู่ในธรรมชาติเป็นสัญญาณต่อเนื่อง สัญญาณต่อเนื่อง (หรืออนาล็อก) มีอยู่สำหรับช่วงเวลาต่อเนื่อง (t1, t2) ซึ่งอาจอยู่ในช่วง −∞ ถึง +∞
Basics of signal processing system
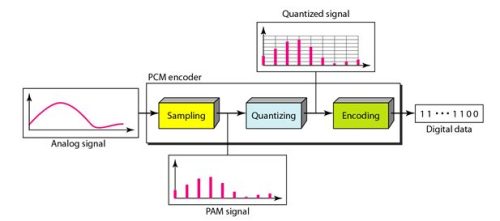
เนื่องจากคอมพิวเตอร์ต้องการสัญญาณดิจิทัลในการประมวลผล ดังนั้น ในการใช้สัญญาณแอนะล็อกบนคอมพิวเตอร์ จะต้องแปลงสัญญาณแอนะล็อกเป็นดิจิทัลด้วยตัวแปลงแอนะล็อกเป็นดิจิทัล จึงจำเป็นต้องมีอินเทอร์เฟซระหว่างสัญญาณแอนะล็อกและโปรเซสเซอร์สัญญาณดิจิทัล
การแปลงสัญญาณจากอนาล็อกเป็นดิจิตอล
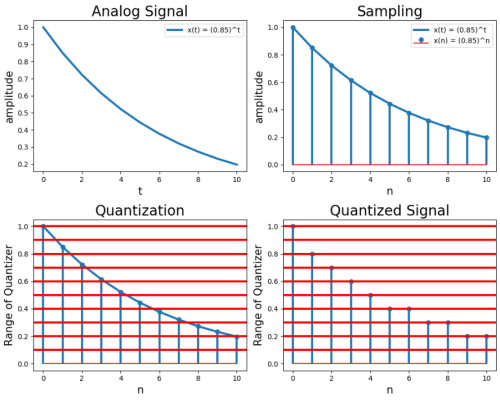
- การสุ่มตัวอย่าง: การสุ่มตัวอย่างคือการลดสัญญาณเวลาต่อเนื่องเป็นสัญญาณเวลาไม่ต่อเนื่อง ตัวอย่างทั่วไปคือการแปลงคลื่นเสียง (สัญญาณต่อเนื่อง) เป็นลำดับของตัวอย่าง (สัญญาณเวลาไม่ต่อเนื่อง)
- การควอนไทซ์: การควอนไทซ์คือกระบวนการจับคู่ค่าอินพุตจากชุดใหญ่ (มักเป็นชุดต่อเนื่อง) กับค่าเอาต์พุตในชุดเล็ก (นับได้) โดยมักมีจำนวนองค์ประกอบจำกัด การวนซ้ำและการตัดทอนเป็นตัวอย่างทั่วไปของกระบวนการควอนไทซ์
- การเข้ารหัส: หลังจากที่ควอนไทซ์ตัวอย่างแต่ละตัวอย่างและกำหนดจำนวนบิตต่อตัวอย่างแล้ว แต่ละตัวอย่างสามารถเปลี่ยนเป็นคำรหัส nb-บิตได้ จำนวนบิตสำหรับแต่ละตัวอย่างจะกำหนดจากจำนวนระดับการควอนไทซ์ หากจำนวนระดับการควอนไทซ์คือ L จำนวนบิตคือ nb=log2.L
t = np.arange(0, 11)
x = (0.85) ** t
Continuous Signal
plt.figure(figsize = (10,8)) # set the size of figure
# 1. Plotting Analog Signal
plt.subplot(2, 2, 1)
plt.title('Analog Signal', fontsize=20)
plt.plot(t, x, linewidth=3, label='x(t) = (0.85)^t')
plt.xlabel('t' , fontsize=15)
plt.ylabel('amplitude', fontsize=15)
plt.legend(loc='upper right')
# 2. Sampling and Plotting of Sampled signal
plt.subplot(2, 2, 2)
plt.title('Sampling', fontsize=20)
plt.plot(t, x, linewidth=3, label='x(t) = (0.85)^t')
n = t
markerline, stemlines, baseline = plt.stem(n, x, label='x(n) = (0.85)^n')
plt.setp(stemlines, 'linewidth', 3)
plt.xlabel('n' , fontsize = 15)
plt.ylabel('amplitude', fontsize = 15)
plt.legend(loc='upper right')
# 3. Quantization
plt.subplot(2, 2, 3)
plt.title('Quantization', fontsize = 20)
plt.plot(t, x, linewidth =3)
markerline, stemlines, baseline=plt.stem(n,x)
plt.setp(stemlines, 'linewidth', 3)
plt.xlabel('n', fontsize = 15)
plt.ylabel('Range of Quantizer', fontsize=15)
plt.axhline(y = 0.1, xmin = 0, xmax = 10, color = 'r', linewidth = 3.0)
plt.axhline(y = 0.2, xmin = 0, xmax = 10, color = 'r', linewidth = 3.0)
plt.axhline(y = 0.3, xmin = 0, xmax = 10, color = 'r', linewidth = 3.0)
plt.axhline(y = 0.4, xmin = 0, xmax = 10, color = 'r', linewidth = 3.0)
plt.axhline(y = 0.5, xmin = 0, xmax = 10, color = 'r', linewidth = 3.0)
plt.axhline(y = 0.6, xmin = 0, xmax = 10, color = 'r', linewidth = 3.0)
plt.axhline(y = 0.7, xmin = 0, xmax = 10, color = 'r', linewidth = 3.0)
plt.axhline(y = 0.8, xmin = 0, xmax = 10, color = 'r', linewidth = 3.0)
plt.axhline(y = 0.9, xmin = 0, xmax = 10, color = 'r', linewidth = 3.0)
plt.axhline(y = 1.0, xmin = 0, xmax = 10, color = 'r', linewidth = 3.0)
plt.subplot(2, 2, 4)
plt.title('Quantized Signal', fontsize = 20)
xq = np.around(x,1)
markerline, stemlines, baseline = plt.stem(n,xq)
plt.setp(stemlines, 'linewidth', 3)
plt.xlabel('n', fontsize = 15)
plt.ylabel('Range of Quantizer', fontsize=15)
plt.axhline(y = 0.1, xmin = 0, xmax = 10, color = 'r', linewidth = 3.0)
plt.axhline(y = 0.2, xmin = 0, xmax = 10, color = 'r', linewidth = 3.0)
plt.axhline(y = 0.3, xmin = 0, xmax = 10, color = 'r', linewidth = 3.0)
plt.axhline(y = 0.4, xmin = 0, xmax = 10, color = 'r', linewidth = 3.0)
plt.axhline(y = 0.5, xmin = 0, xmax = 10, color = 'r', linewidth = 3.0)
plt.axhline(y = 0.6, xmin = 0, xmax = 10, color = 'r', linewidth = 3.0)
plt.axhline(y = 0.7, xmin = 0, xmax = 10, color = 'r', linewidth = 3.0)
plt.axhline(y = 0.8, xmin = 0, xmax = 10, color = 'r', linewidth = 3.0)
plt.axhline(y = 0.9, xmin = 0, xmax = 10, color = 'r', linewidth = 3.0)
plt.axhline(y = 1.0, xmin = 0, xmax = 10, color = 'r', linewidth = 3.0)
plt.tight_layout()
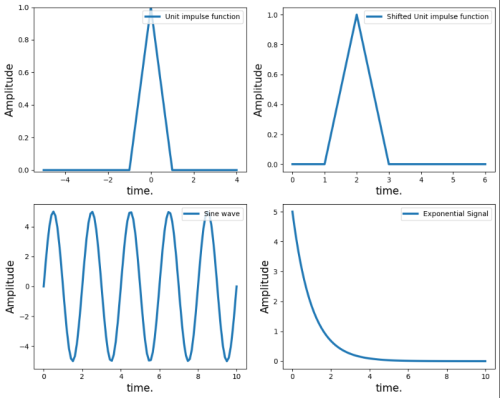
Unit Impulse Signal
impulse = signal.unit_impulse(10, 'mid')
shifted_impulse = signal.unit_impulse(7, 2)
# Sine wave
t = np.linspace(0, 10, 100)
amp = 5 # Amplitude
f = 50
x = amp * np.sin(2 * np.pi * f * t)
# Exponential Signal
x_ = amp * np.exp(-t)
plt.figure(figsize=(10, 8))
plt.subplot(2, 2, 1)
plt.plot(np.arange(-5, 5), impulse, linewidth=3, label='Unit impulse function')
plt.ylim(-0.01,1)
plt.xlabel('time.', fontsize=15)
plt.ylabel('Amplitude', fontsize=15)
plt.legend(fontsize=10, loc='upper right')
plt.subplot(2, 2, 2)
plt.plot(shifted_impulse, linewidth=3, label='Shifted Unit impulse function')
plt.xlabel('time.', fontsize=15)
plt.ylabel('Amplitude', fontsize=15)
plt.legend(fontsize=10, loc='upper right')
plt.subplot(2, 2, 3)
plt.plot(t, x, linewidth=3, label='Sine wave')
plt.xlabel('time.', fontsize=15)
plt.ylabel('Amplitude', fontsize=15)
plt.legend(fontsize=10, loc='upper right')
plt.subplot(2, 2, 4)
plt.plot(t, x_, linewidth=3, label='Exponential Signal')
plt.xlabel('time.', fontsize=15)
plt.ylabel('Amplitude', fontsize=15)
plt.legend(fontsize=10, loc='upper right')
plt.tight_layout()
Sine wave
# Sine wave
n = np.linspace(0, 10, 100)
amp = 5 # Amplitude
f = 50
x = amp * np.sin(2 * np.pi * f * n)
# Exponential Signal
x_ = amp * np.exp(-n)
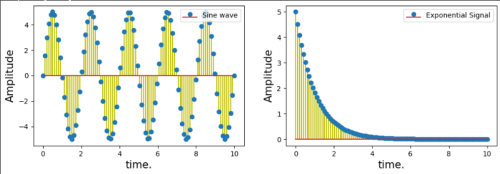
Discrete Signals
plt.figure(figsize=(12, 8))
plt.subplot(2, 2, 1)
plt.stem(n, x, 'yo', label='Sine wave')
plt.xlabel('time.', fontsize=15)
plt.ylabel('Amplitude', fontsize=15)
plt.legend(fontsize=10, loc='upper right')
plt.subplot(2, 2, 2)
plt.stem(n, x_, 'yo', label='Exponential Signal')
plt.xlabel('time.', fontsize=15)
plt.ylabel('Amplitude', fontsize=15)
plt.legend(fontsize=10, loc='upper right')
Fourier Transforms
การแปลงฟูเรียร์เป็นเครื่องมือที่มีประสิทธิภาพสำหรับการวิเคราะห์สัญญาณและใช้ในทุกอย่างตั้งแต่การประมวลผลเสียงไปจนถึงการประมวลผลภาพและการบีบอัดภาพ
การวิเคราะห์ฟูเรียร์เป็นสาขาที่ศึกษาว่าฟังก์ชันทางคณิตศาสตร์สามารถแยกย่อยเป็นฟังก์ชันตรีโกณมิติที่ง่ายกว่าชุดหนึ่งได้อย่างไร การแปลงฟูเรียร์เป็นเครื่องมือจากสาขานี้สำหรับแยกย่อยฟังก์ชันเป็นความถี่ส่วนประกอบ กล่าวอีกนัยหนึ่ง การแปลงฟูเรียร์เป็นเครื่องมือที่ช่วยให้คุณรับสัญญาณและดูกำลังของแต่ละความถี่ในนั้น ลองดูคำศัพท์สำคัญในประโยคนั้น:
- สัญญาณคือข้อมูลที่เปลี่ยนแปลงไปตามเวลา ตัวอย่างเช่น เสียง วิดีโอ และร่องรอยแรงดันไฟฟ้าเป็นตัวอย่างของสัญญาณ
- ความถี่คือความเร็วที่บางสิ่งทำซ้ำ ตัวอย่างเช่น นาฬิกาเดินด้วยความถี่หนึ่งเฮิรตซ์ (Hz) หรือหนึ่งการทำซ้ำต่อวินาที
- ในกรณีนี้ กำลังหมายถึงความแรงของแต่ละความถี่
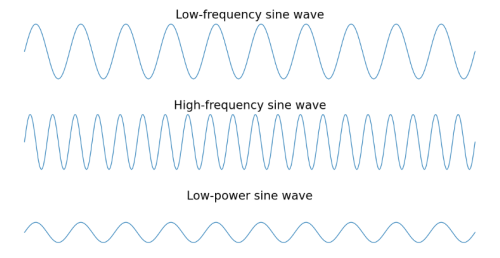
รูปภาพต่อไปนี้เป็นการสาธิตภาพความถี่และกำลังของคลื่นไซน์บางคลื่น:
จุดสูงสุดของคลื่นไซน์ความถี่สูงจะอยู่ใกล้กันมากกว่าจุดสูงสุดของคลื่นไซน์ความถี่ต่ำ เนื่องจากเกิดขึ้นซ้ำบ่อยกว่า คลื่นไซน์กำลังต่ำจะมีจุดสูงสุดที่เล็กกว่าคลื่นไซน์อีกสองคลื่น
เหตุใดคุณจึงต้องใช้การแปลงฟูเรียร์
การแปลงฟูเรียร์มีประโยชน์ในแอปพลิเคชันต่างๆ มากมาย การบีบอัดภาพใช้การแปลงฟูเรียร์แบบแปรผันเพื่อลบส่วนประกอบความถี่สูงของภาพ การจดจำเสียงใช้การแปลงฟูเรียร์และการแปลงที่เกี่ยวข้องเพื่อกู้คืนคำพูดจากเสียงที่ยังไม่ได้แปลง
โดยทั่วไปแล้ว คุณต้องใช้การแปลงฟูเรียร์หากคุณต้องการดูความถี่ในสัญญาณ หากการทำงานกับสัญญาณในโดเมนเวลาเป็นเรื่องยาก การใช้การแปลงฟูเรียร์เพื่อย้ายสัญญาณไปยังโดเมนความถี่ก็คุ้มค่าที่จะลอง
โดเมนความถี่คืออะไร?
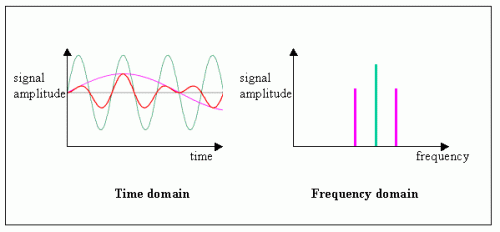
โดเมนความถี่หมายถึงพื้นที่วิเคราะห์ที่ฟังก์ชันทางคณิตศาสตร์หรือสัญญาณถูกส่งผ่านในรูปของความถี่แทนที่จะเป็นเวลา ตัวอย่างเช่น กราฟโดเมนเวลาอาจแสดงการเปลี่ยนแปลงตามเวลา แต่กราฟโดเมนความถี่จะแสดงว่ามีสัญญาณอยู่มากเพียงใดในแต่ละย่านความถี่ที่กำหนด อย่างไรก็ตาม สามารถแปลงข้อมูลจากโดเมนเวลาเป็นโดเมนความถี่ได้ ตัวอย่างของการแปลงดังกล่าวคือการแปลงฟูเรียร์ การแปลงฟูเรียร์จะแปลงฟังก์ชันเวลาเป็นชุดคลื่นไซน์ที่แสดงความถี่ต่างๆ การแสดงสัญญาณในโดเมนความถี่เรียกว่าสเปกตรัมของส่วนประกอบความถี่
โดเมนความถี่ทำงานอย่างไร?
โดเมนความถี่ทำงานโดยอนุญาตให้แสดงพฤติกรรมเชิงคุณภาพของระบบ ตลอดจนลักษณะเฉพาะของวิธีการตอบสนองของระบบต่อการเปลี่ยนแปลงแบนด์วิดท์ เกน การเลื่อนเฟส ฮาร์โมนิก และอื่นๆ การกระจายที่ใช้โดเมนความถี่สำหรับการแสดงกราฟิกคือในดนตรี บ่อยครั้งที่ผู้ผลิตเสียงและวิศวกรแสดงสัญญาณเสียงภายในโดเมนความถี่เพื่อให้เข้าใจรูปร่างและลักษณะของสัญญาณเสียงได้ดีขึ้น
การสร้างสัญญาณใหม่
ในการประมวลผลสัญญาณ การสร้างสัญญาณใหม่มักหมายถึงการกำหนดสัญญาณต่อเนื่องเดิมจากลำดับของตัวอย่างที่มีระยะห่างเท่ากัน
- ทฤษฎีบทการสุ่มตัวอย่างแบบไนควิสต์ของแชนนอน: ฟังก์ชันที่ไม่มีความถี่สูงกว่า wHz จะถูกกำหนดอย่างสมบูรณ์โดยการสุ่มตัวอย่างที่ 2wHz
ทฤษฎีบทการสุ่มตัวอย่างแบบไนควิสต์
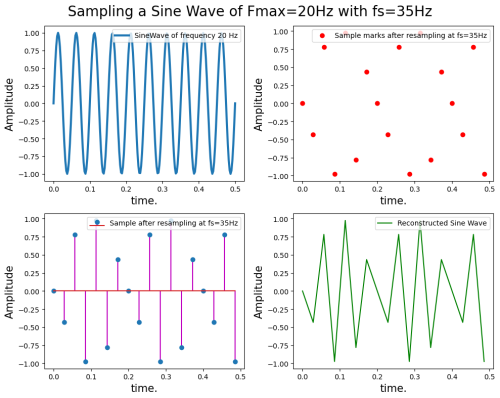
ทฤษฎีบทการสุ่มตัวอย่างแบบไนควิสต์ระบุว่า “ความถี่ในการสุ่มตัวอย่าง fs ควรมากกว่าหรือเท่ากับสองเท่าของความถี่สูงสุดของสัญญาณ (สัญญาณเวลาต่อเนื่อง) ที่จะสุ่มตัวอย่าง”
หาก Fmax คือความถี่สูงสุดของสัญญาณ ตามทฤษฎีบทการสุ่มตัวอย่าง: fs >= 2Fmax
ทฤษฎีบทการสุ่มตัวอย่างมีความสำคัญมากหากเราต้องการสร้างสัญญาณใหม่หลังจากการสุ่มตัวอย่าง
f = 20 # Hz
t = np.linspace(0, 0.5, 200)
x1 = np.sin(2 * np.pi * f * t)
s_rate = 35 # Hz. Here the sampling frequency is less than the requirement of sampling theorem
T = 1 / s_rate
n = np.arange(0, 0.5 / T)
nT = n * T
x2 = np.sin(2 * np.pi * f * nT) # Since for sampling t = nT.
print(len(t))
print(len(nT))
200
18
plt.figure(figsize=(10, 8))
plt.suptitle("Sampling a Sine Wave of Fmax=20Hz with fs=35Hz", fontsize=20)
plt.subplot(2, 2, 1)
plt.plot(t, x1, linewidth=3, label='SineWave of frequency 20 Hz')
plt.xlabel('time.', fontsize=15)
plt.ylabel('Amplitude', fontsize=15)
plt.legend(fontsize=10, loc='upper right')
plt.subplot(2, 2, 2)
plt.plot(nT, x2, 'ro', label='Sample marks after resampling at fs=35Hz')
plt.xlabel('time.', fontsize=15)
plt.ylabel('Amplitude', fontsize=15)
plt.legend(fontsize=10, loc='upper right')
plt.subplot(2, 2, 3)
plt.stem(nT, x2, 'm', label='Sample after resampling at fs=35Hz')
plt.xlabel('time.', fontsize=15)
plt.ylabel('Amplitude', fontsize=15)
plt.legend(fontsize=10, loc='upper right')
plt.subplot(2, 2, 4)
plt.plot(nT, x2, 'g-', label='Reconstructed Sine Wave')
plt.xlabel('time.', fontsize=15)
plt.ylabel('Amplitude', fontsize=15)
plt.legend(fontsize=10, loc='upper right')
plt.tight_layout()


